Data Management
Collecting, Organizing and Displaying Data
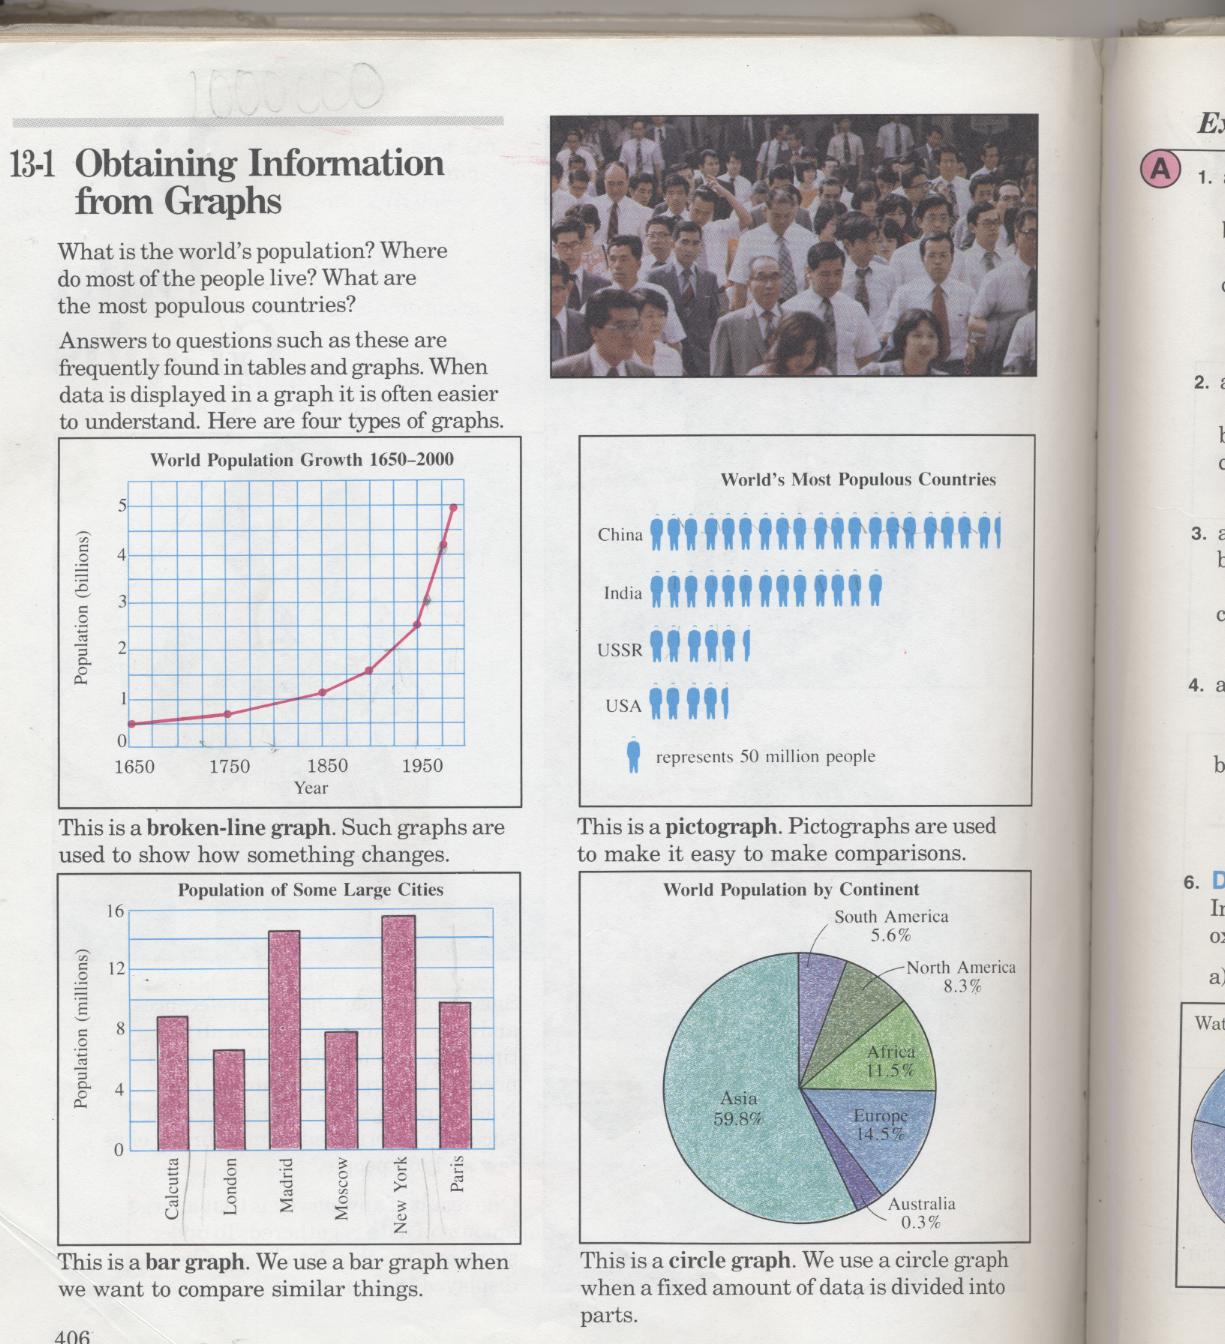
Graphs can be used to visually represent the relationship of data. It can help organize and show people statistics, which can be good for some and not so good for others, depending on what the statistics show. Organizing data graphically can come in handy in fields like business, sports, teaching, politics, advertising, etc.. We see graphs in the newspapers, magazines, and on television because they help us to communicate information. Many different types of graphs exist, and each has something different about it that makes it useful in a unique way. In this unit we will look at how information is collected, organized and displayed.
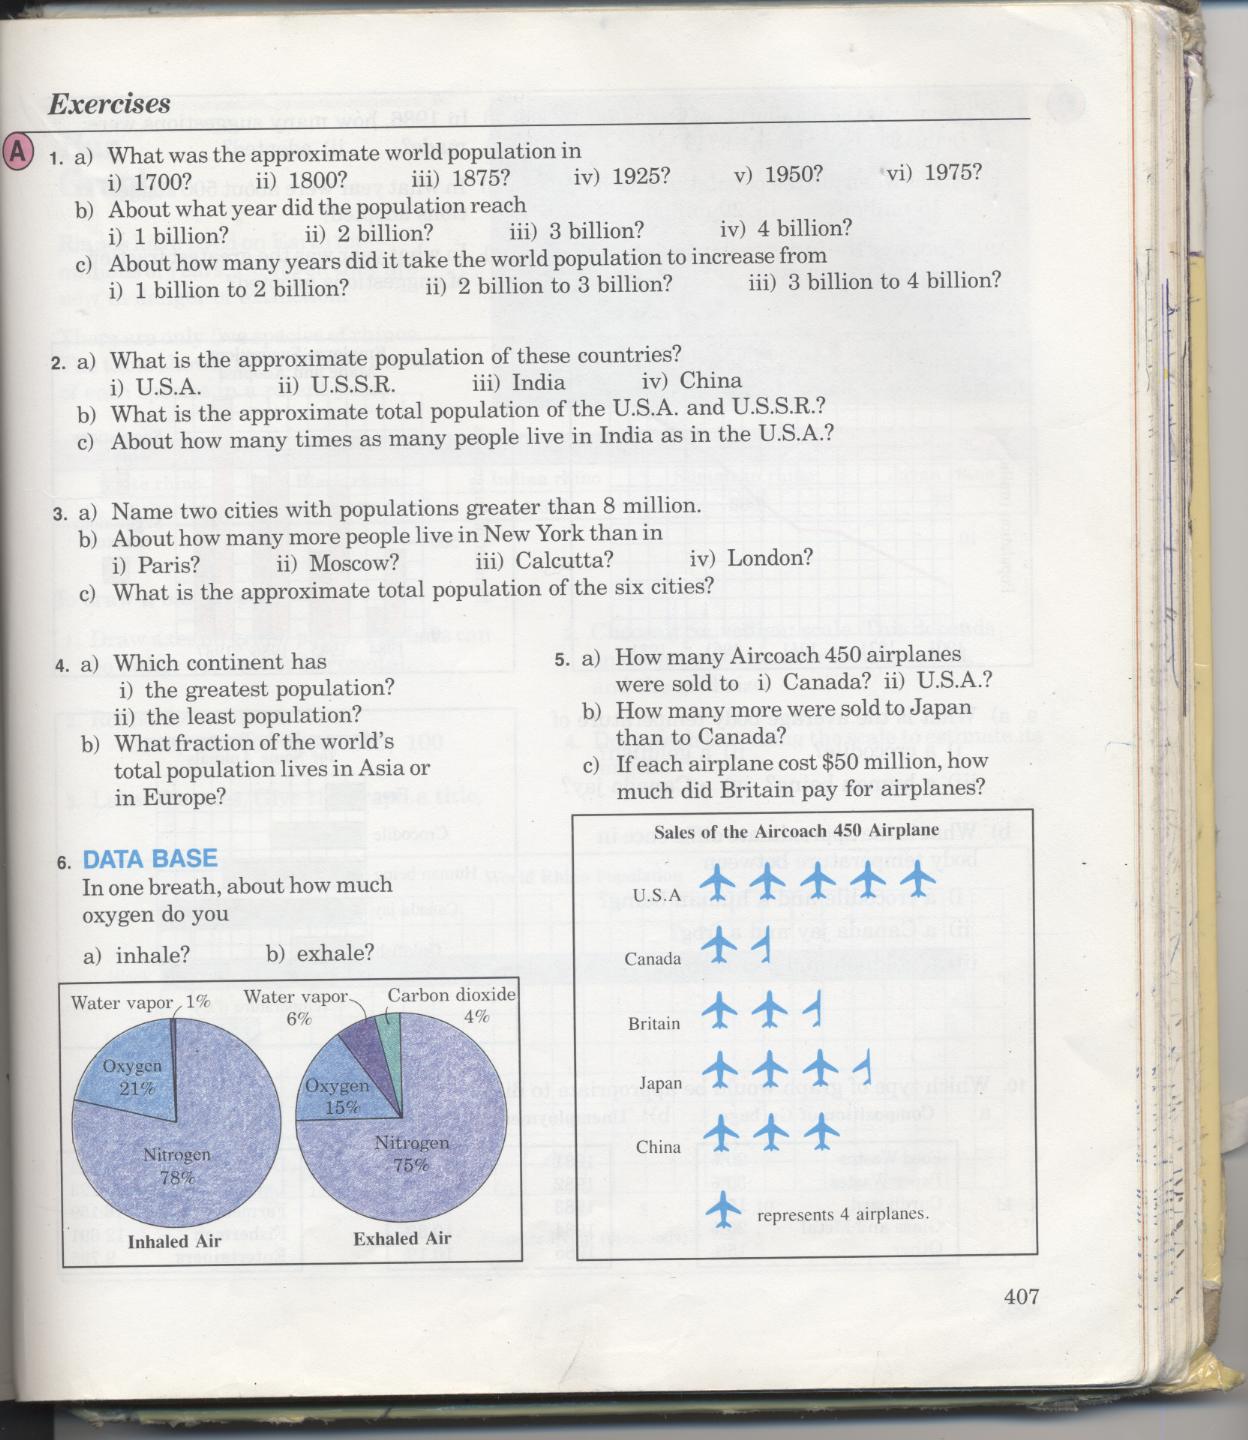
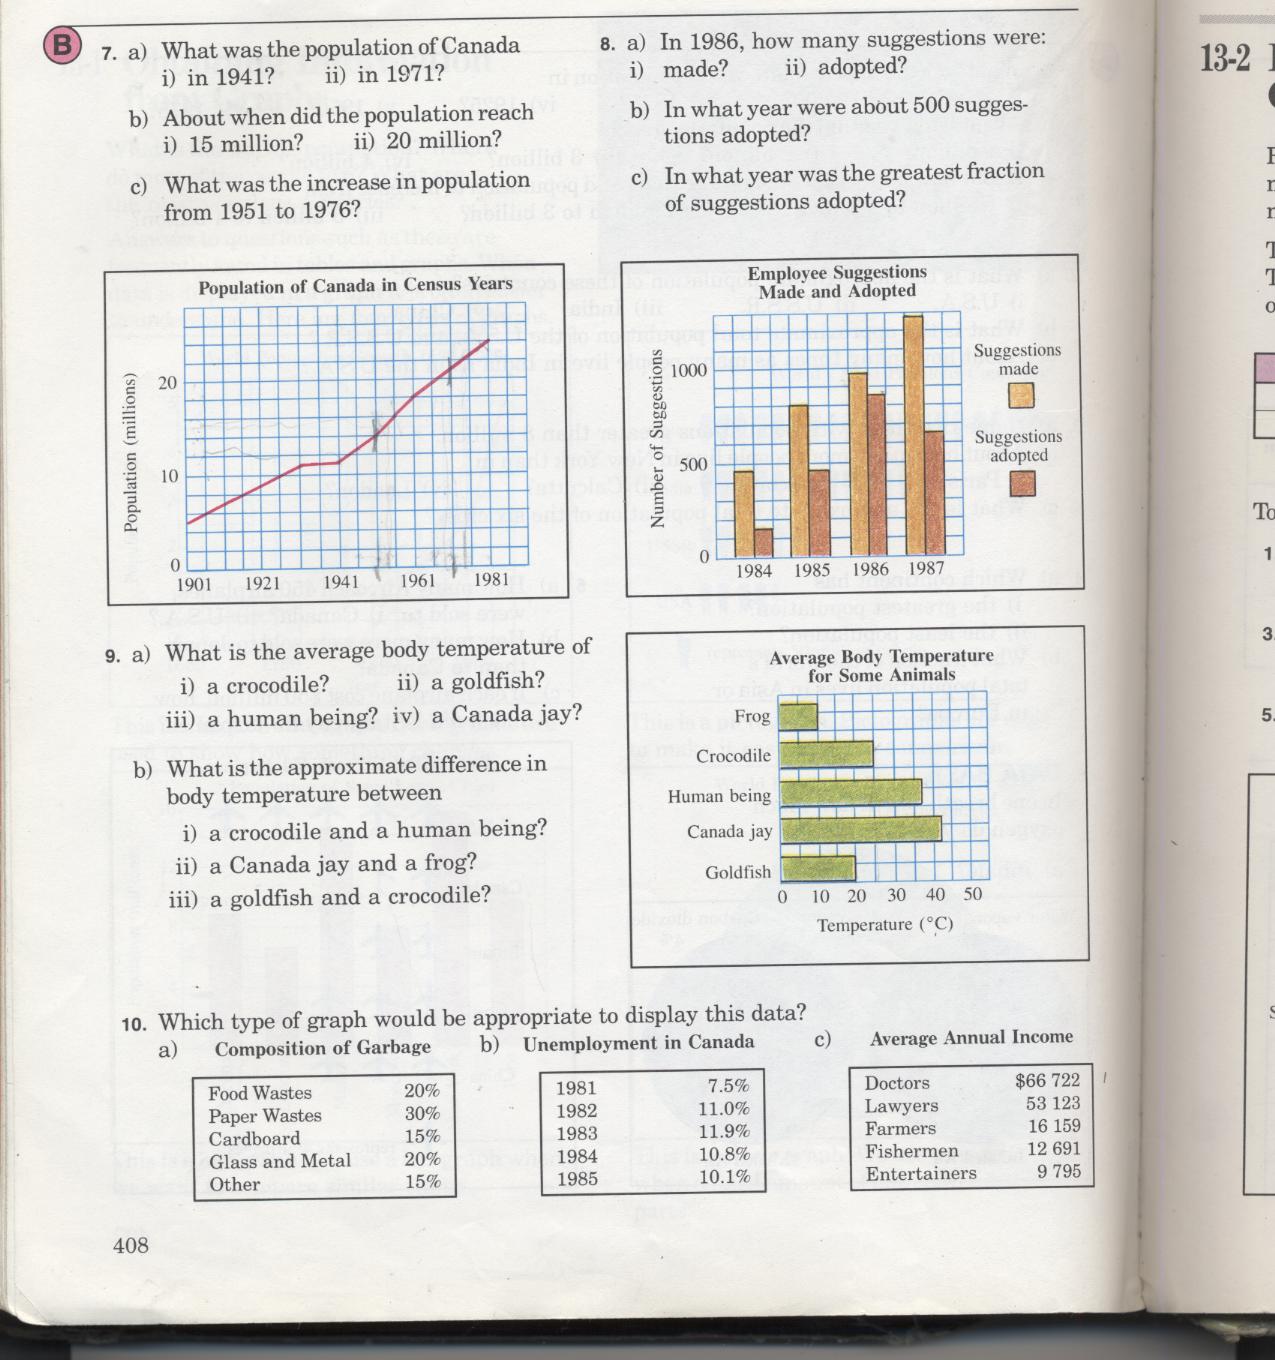
Day #1 Obtaining Information from Graphs (from handouts p. 406-408 #3-5, 7-10)
Handouts
/uploads/6/5/3/3/6533755/obtaining_information_from_graph_part_1.jpg
/uploads/6/5/3/3/6533755/obtaining_information_from_graph_part_2.jpg
/uploads/6/5/3/3/6533755/obtaining_information_from_graph_part_3.jpg
Day #2 Organizing and Presenting Data p. 94, 95 #4,5,7
Reminders
Collecting, Organizing and Displaying Data
Graphs can be used to visually represent the relationship of data. It can help organize and show people statistics, which can be good for some and not so good for others, depending on what the statistics show. Organizing data graphically can come in handy in fields like business, sports, teaching, politics, advertising, etc.. We see graphs in the newspapers, magazines, and on television because they help us to communicate information. Many different types of graphs exist, and each has something different about it that makes it useful in a unique way. In this unit we will look at how information is collected, organized and displayed.
Day #1 Obtaining Information from Graphs (from handouts p. 406-408 #3-5, 7-10)
Handouts
/uploads/6/5/3/3/6533755/obtaining_information_from_graph_part_1.jpg
/uploads/6/5/3/3/6533755/obtaining_information_from_graph_part_2.jpg
/uploads/6/5/3/3/6533755/obtaining_information_from_graph_part_3.jpg
Day #2 Organizing and Presenting Data p. 94, 95 #4,5,7
Reminders
- Bar Graph - used to compare data
- Histogram - similar to bar graph, but have a range of data (bars touch each other)
- Line Graph - shows a trend/change over time (can be used to make a prediction
- Scatterplot - considers relationship between two variables (not usually time)
- Pictograph - representation of data using visual symbols
- Circle Graph - is used when considering parts of a whole quantities involving percents
- Stem and Leaf Plot - is used when considering a single variable
Day # 3 Scatter Plots and Stem and Leaf Plots p. p435-437
Reminders
Reminders
- Scatterplot shows relationship between two variables
- Independent variable (variable not affected by the other) is on the bottom
- Dependent is on the side
- Go up by a standard interval on both axes
- Stem and Leaf Plot has a column of stems and leafs and is a compact way of writing a list of numbers
- For 94, 97 and 99 the stem is 9 and the leafs are 4, 7, 9
Day # 4 Mid Chapter Review p. 103 #1-3, 4b,c
Reminders
Day #5 Histograms p.107 #5,6,7,8,9a,b
Reminders
Reminders
- Be sure all graphs have titles that are underlined
- Be sure to use a standard interval when labelling axe
Day #5 Histograms p.107 #5,6,7,8,9a,b
Reminders
- Histogram uses bars to display intervals or ranges of data
- Unlike bar graphs the bars should touch
- Try to create intervals that for 5-7 bars
- Values that fall where two intervals intersect are usually placed in the higher interval
- In order to create historgrams you will need to organize your information in frequency table
Day #6 Exploring Sample Size #1-3
Day #7 Mean, Median & Mode p.110 #5-10
- When give a sample of numbers, be sure to order them from smallest to biggest.
- Mean is the average. Mean = Total Sum of the numbers/total number of items
- Median is the middle number. When you have an even number of numbers you need to add up the middle two numbers and divide by two to get the median. For an odd number of numbers simply select the middle number.
- Mode is the most frequently occurring number.
Day #8 Communicating About Graphs p.114, 115 #4,5
Day #9 Chapter Review p.117 #1-6
Day #10 Chapter Self Test
Day #9 Chapter Review p.117 #1-6
Day #10 Chapter Self Test
Probability
Day #1 Theoretical and Experimental Probability p.406 #5-11
Reminders
Day #1 Theoretical and Experimental Probability p.406 #5-11
Reminders
- Theoretical Probability = # of Favourable Outcomes
- Total Outcomes
- Experimental Probability = # of Trials with a Favourable Outcom
- Total # of Trials
- Probability is expressed as a fraction or a percent.
- An outcome is a single result that can occur in an experiment. For example when tossing a coin the possible outcomes are heads or tails.
Day #2 Calculating Probability p. 410 #6-11
Reminders
Reminders
- Compound Probability =Probability of Event A x Probability of Event B...
Day #3 Mid Chapter Review p.411 #1-5
Reminders
Day #4 Calculating Probability (Complementary Events) p.410 #6-11
Reminders
Calculate the probability of each event separately and the multiply
Day #5 Using Simulations to Determine Probability p. 420 #3-6
Day #6 Chapter Review p. 425 #1-6
Day #7 Chapter Self Test p. 423 #1-7
Reminders
- When in doubt write out all the possible outcomes to help solve questions
Day #4 Calculating Probability (Complementary Events) p.410 #6-11
Reminders
Calculate the probability of each event separately and the multiply
Day #5 Using Simulations to Determine Probability p. 420 #3-6
Day #6 Chapter Review p. 425 #1-6
Day #7 Chapter Self Test p. 423 #1-7
